
Decibel Scale – Complete Guide
- Basil M Jose
- Feb 15, 2023
- 22 min read
Updated: Feb 14
Decibel Scale – Complete Guide - dBSPL, dBu, dBV, dBm Explained
Table of Contents

Decibel (dB)
The first use of the decibel scale was for the measurement of power in the telephony of the early 20th century in the Bell System in the United States. One decibel = 1/10th of one bel (hence the name ‘Deci’), named in honour of Alexander Graham Bell. The ISO Standard 80000-3:2006 sets out the following quantities. ‘The decibel (dB) is one-tenth of a bel, which means 1 dB = 0.1 B
The decibel was used for a wide variety of measurements in science and engineering in the 20th century. In electronics, the Amplifier Gains, Signal attenuations, and Signal-to-Noise ratios (S/N) are often expressed in decibels.
Decibel Scale (dB scale)
In audio, the decibel scale is used to indicate the ratio of one value to another, on a logarithmic scale. The values can be Power quantity or Field quantity. In other words, you can use the decibel scale to detail a ratio of power to power or field to field quantity.
A decibel scale does not have a unit by itself. If someone tells you stuff like “10 dB”, ask the question “10 dB of what?” The ratio can be related to Power, SPL (Sound Pressure Level), Intensity or Voltage (or anything you can think of as long as they are having the same units).
For example, if the reference unit is volt, then the suffix will be “V” (for instance “10 dBV”), and if the reference unit is milliwatt, then the suffix will be “m” (for instance “10 dBm”)
As mentioned above, two different scales are used when expressing a ratio in decibels, depending on the nature of the quantities:
(1) Power and (2) Field (Root-power).
Power quantities
When measuring power quantities, a ratio can be stated as a level in decibels.
This is calculated using the formula: Lp = 10 x log10 (P/P0) dB Generally, base-10 logarithm is used, unless otherwise mentioned. Therefore, the above formula becomes Lp = 10 x log (P/P0) dB
Lp = Ratio of Power quantity in dB, P = Measured power, P0 = Reference power
Field quantities and Root-power quantities
When measuring field quantities, it is common to consider the ratio of the squares of
F (measured field) and F0 (reference field).
Therefore, the following definition is used: Lf = 20 x log (F/F0) dB Lf = Ratio of field quantity in dB, F = Measured field, F0 = Reference field.
That means when the power is changed by a factor of 10, it results in a 10 dB of change in level. When the amplitude (field quantity) is changed by a factor of 10, it results in a 20 dB change in level.
Why do we use the Decibel Scale to measure Sound?
The human ear is an extremely flexible and amazing hearing device. They are capable of registering a broad range of frequencies and sound pressure levels.
Just for your information, the ratio of the sound pressure that causes ear damage from the threshold of hearing (the slightest sound you can hear) is more than a million
It is impossible to depict these much of values on a linear scale. In addition to that, do you know that our ears do not perceive the ‘sound level difference’ in a linear way?
Decibel Scale Example
You drop a pin on the floor from a height of 2 metres. It creates a change in the sound pressure. Now you drop 2 pins from the same height at the same time. It creates a different sound pressure than the first. Your ears will be able to grab the difference.
Now imagine you dropping 100 pins from the same height, the sound pressure is much higher and your ears will pick up the difference.
Here is the interesting part. Now you drop 101 pins. Yes, it produces a different sound pressure, but your ears will not be able to grab the difference from the sound pressure caused by 100 pins.
Imagine you dropping 1000 pins from the same height, the sound pressure is much higher and your ears will pick up the difference from the sound pressure caused by dropping 100 pins. After that, you drop 1010 pins (or even 1100 pins). Yes, it produces a different sound pressure, but your ears will not be able to grab the difference from the sound pressure caused by 1000 pins.
Although the ear can distinguish the increase in level between one or two pins dropping, it cannot distinguish between 1,000,000 pins and 1,000,001 pins or even 1,000,100 because it is not a linear instrument.
This is one of the reasons why many people use white noise / pink noise / rainy sounds to sleep. It can easily mask any other sounds in the normal speaking volume range.
On the other hand, our ears can identify the substantial multiplying of the energy of the sound. To make it simpler to manage this large range, a logarithmic scale was adopted, as linear scales measure straightforward changes in quantities, while logarithmic scales measure exponential changes. Therefore each mark on the decibel scale is the previous mark multiplied by a value.
Sound Pressure & Sound Pressure Level (SPL)
Sound Pressure
As we all learnt in High School, The atmospheric pressure (or barometric pressure), is the pressure within the atmosphere of Earth and it is measured as 101,325 Pa (1,013.25 hPa or 1,013.25 millibars)
The SI unit of pressure is the Pascal (Pa). It is additionally expressed in N/m² (Newton per sq. metre).
Sound pressure (p) is the local pressure variation from the average atmospheric pressure, caused by any sound. Any sound at a given place will vary (reduce) the average atmospheric pressure at that place by a certain amount.
Threshold of hearing
The minimum sound level of a pure sound (or pure tone) that an average human ear can hear normally, provided no other sound exists. This is also known as the Auditory threshold.
Historically, there were some experiments conducted to fix a reference sound pressure and this was measured as an RMS sound pressure of 20 µPa (20 micro Pascals = 0.00002 Pa) at 25 °C. This is recognised as the threshold of human hearing (roughly the sound of a mosquito flying 3m away). It is approximately the quietest sound a young human with unimpaired hearing can hear at 1,000 Hz. Therefore, 20 µPa is used as the reference pressure.
Note: The threshold of hearing is different at different frequency ranges. Read more on Fletcher Munson Curve
Sound Pressure Level (dB SPL)
It is a logarithmic measure (ratio) of the effective pressure of a sound (P) relative to a reference value (P0).
Generally, the reference value (P0) is the Auditory Threshold (= 0.00002 Pa) unless otherwise stated. SPL is measured in decibels (dB).
Sound is usually measured with microphones and they respond proportionally to the sound pressure, P. Now the power in a sound wave goes as the square of the pressure. Therefore, this is a field quantity.
The difference in sound pressure level between two sounds with P and P0 is, therefore: Lp = 20 x log10 (P/P0) dB SPL where Lp is the sound pressure level; P is the actual sound pressure caused by a sound wave; P0 is the reference sound pressure (0.00002 Pa).
Examples showing different SPL (SPL is measured from the listener’s position, not at the source):
Sound of rustling leaves in the distance
Measured Pressure = 0.000063 Pa So, P = 0.000063 Pa, P0 = 0.00002 Pa SPL = 20 log (P/P0) = 20 log (0.000063/0.00002) ==> 20 log (3.15) = 20 x 0.498 = 9.966 dB SPL (≈ 10 dB SPL)
The sound inside a quiet library
Measured Pressure = 0.002 Pa So, P = 0.002 Pa, P0 = 0.00002 Pa SPL = 20 log (P/P0) = 20 log (0.002/0.00002) ==> 20 log (100) = 20 x 2 = 40 dB SPL
Sound at a busy city road
Measured Pressure = 0.2 Pa P = 0.2 Pa, P0 = 0.00002 Pa SPL = 20 log (P/P0) = 20 log (0.2/0.00002) ==> 20 log (10000) = 20 x 4 = 80 dB SPL
Sound at Anechoic chamber, Orfield Labs
Measured Pressure = 0.0000068 Pa P = 0.0000068 Pa, P0 = 0.00002 Pa SPL = 20 log (P/P0) = 20 log (0.0000068/0.00002) ==> 20 log (0.34) = 20 x -0.4685 = -9.37 dB SPL
Based on the above examples; When the Sound Pressure changed 3.15 times, the equivalent change in dB SPL was 10. When the Sound Pressure changed 100 times, the equivalent change in dB SPL was 40. When the Sound Pressure changed 10000 times, the equivalent change in dB SPL was 80
As a rule of thumb, +6 dB = sound pressure level increased by twice, +10 dB = sound pressure level increased by 3 times & +20 dB = sound pressure level increased by 10 times.
The Sound Pressure Level depends on the distance between the sound source and the place of measurement, possibly one ear of a listener. The distance is measured in metres. That means, when the distance is doubled, the observed Sound pressure Level will drop by 6 dB.

What is 0 dB SPL?
The lowest sound a healthy human can hear is the limit of audibility. It is defined as an SPL of 0 dB. This level occurs when the measured SPL is equal to the reference level.
i.e., P = P0 = 0.00002 Pa In this case,
SPL = 20 log (P/P0) = 20 log (0.00002/0.00002) = 20 log (1) = 20 x 0 = 0 dB SPL
Therefore 0 dB SPL does not mean ‘no sound’, it simply means a sound level where the sound pressure is equivalent to that of the reference level. This is still a small change in pressure, but not zero.
It is possible to have negative sound levels: – 10 dB would mean a sound with pressure 3 times smaller than the reference pressure.
Inside the quietest place on earth, which is currently Microsoft’s Anechoic chamber hidden in the depths of Building 87 at Microsoft’s headquarters in Washington, the sound pressure was measured as 0.0000019 Pa. The related SPL ratio is
20 log (0.0000019/0.00002) = 20 log (0.095) = 20 x -1.0223 = -20.45 dB SPL
What is the highest sound pressure possible? What is the loudest noise possible?
The Average Atmospheric Pressure is 101,325 Pa. Any sound pressure above this value will create shockwaves which are technically not sound waves anymore. This means the greatest sound pressure we can have in the atmosphere without causing shock waves is 101,325 Pa.
So we come back to the same Equation, Lp = 20 log (P/P0) where P = 101325 Pa, P0 = 0.00002 Pa SPL = 20 log (P/P0) = 20 log (101325/0.00002) ==> 20 log (5,066,250,000) = 20 x 97 = 194 dB SPL.
Theoretically, this is the highest possible SPL caused by a Soundwave.
When sufficient energy is released to exceed the 194 dB SPL mark, it is too much to create a sustained pressure wave. At 194 dB SPL, there is a fully exhausted wave alternating between double the normal pressure and a total vacuum. This extra energy starts distorting the entire wave, and you end up with something that is more a shockwave and less a soundwave. At that level, sounds do not pass through the air. Instead, they push the air along, producing pressurised bursts (shockwaves).
Pay attention, 194 dB SPL is an RMS value, not a peak value. Even louder noise is plausible but it will be chaos. This high sound pressure will damage all measurement microphones and human beings will be completely ripped when they are close to the centre of a 194 dB SPL source. No hearing protection (ear muffs or earplugs) can help you there. These sound levels will never be measured but only estimated or calculated. When the shock wave from a bomb levels a house, that is the sound wave tears apart bricks and splintering glass.
The loudest sound in mankind’s history:
On Aug. 27, 1883, farmers on a sheep camp outside Alice Springs, Australia, heard a sound like two shots from a rifle. At that moment, 2,233 miles away, the Indonesian volcanic island of Krakatoa was erupting. Scientists believe this is probably the loudest sound humans have ever recorded.
Again, the Sound Pressure at Alice Springs was way lower than the actual Sound Pressure at the centre of the volcano. Obviously, nobody could measure it. Not only are there records of people hearing the sound of Krakatoa thousands of miles away, but there is also physical evidence that the sound of the volcano’s explosion travelled all the way around the globe multiple times.
The Krakatoa explosion registered 172 dB SPL at 100 miles (160,934 metres!) from the source. It destroyed the eardrums of people who were 100 miles away. It is estimated that the Krakatoa eruption reached 310 dB SPL at its core, evidence of a destructive force that nature can unleash.
The Krakatoa eruption was one of the most destructive volcanic events in recorded history

Image source: Wikipedia An 1888 lithograph of the 1883 eruption of Krakatoa
Decibel Scale – Complete Guide - dBm, dBu, dBV, DAW Meters Explained
Decibel Scale Meters in DAW & Amplifiers
The Decibel Meters you see in your DAW (Digital Audio Workstations) and Amplifiers are not for measuring Sound Pressure Levels. Sound Pressure is to be measured from the atmosphere (or air) itself.
dB Meters in Electronic equipment (Amplifiers, Signal Processors) and Music Recording Software have different functions. In other words, dB SPL is to measure Acoustical Signals whereas dBm, dBu, dBv, and dBV are to measure electrical signals. Let's look at some of the dB scales.
dBm
The unit dBm (decibel-milliwatts) denotes an Absolute power level measured in decibels and referenced to 1 milliwatt (mW). This unit of measurement was an industry-standard in the 1940s.
When the unit was first designed, it was mainly used to measure the 600-ohm telephone line. To convert from absolute power "P" (watts) to dBm, use the following formula dBm = 10log (P / 1 mW). The power level (P) has been referenced to 1 mW.
Many of the equipment used in the audio world, are not that concerned with the power levels but are very sensitive to voltage levels. Hence we normally will not see these meters on your DAW or Amplifiers or Mixers.
dBu
dBu scale is used to measure input and output levels (on a decibel scale) for Professional Audio equipment (Example: your studio mixer, Amplifier). It is a logarithmic ratio of two voltages (V to V0) with a reference voltage of V0 = 0.7746 volts. So 0 dBu = 0.7746 volts. The formula to calculate dBu is, dBu = 20log (V1 / V0) where V0 = 0.7746 volts. In other words, dBu = 20log (V1 / 0.7746)
Why 0.7746 volt was chosen as the reference value?
This was chosen historically as it represented the voltage that produces 1 milliwatt of power in a 600-ohm resistor (refer to the dBm scale explained above). P = 0.001 W, R = 600 Ω. We know that P = V2 / R ==> 0.001 = V2 / 600 ==> V2 = 0.001*600 ==> V2 = 0.6 ==> V = √0.6 = 0.7746 volts Since 0.7746 volts was chosen (or standardised) a long time ago, we still follow it.
Please take note, the voltages are not peak values. The voltage is measured using quadratic mean (also called root mean square, RMS). Hence the Peak value of the reference voltage V0 will be [ VP = VRMS × √2 ] = [ 0.7746 × √2 ] = 1.0954 (Just for information only)
The dBu value was elected to avoid confusion with the dBm standard. So, for a 600 Ω load, both dBm and the dBu will have the same readings. In the past, the dBu voltage ratio scale was denoted as dBv (small letter v). This was later denoted as dBu in order to avoid confusion with the dBV (capital letter V). That means dBu = dBv (Therefore we use dBu and dBV).
Example:
The maximum output voltage (RMS) your pre-amp can deliver is, let's say 7 volts. Now, E1 = 7 v & E0 = 0.7746 v The maximum gain (voltage ratio) of your pre-amp will be 20log (E1 / E0) ==> 20log (7 / 0.7746) ==> 20log 9.03 = 20 x 0.956 = +19 dBu
+4 dBu is used as a line-level reference because the 1.2277 volts traditionally (from way back in the tube days) was an ideal voltage over the plate noise (noise levels were moderately high for many tubes) that has a good signal-to-noise ratio while still having enough headroom to allow for peaks. Line level is the specified strength of an audio signal used to transmit analogue sound between audio components.

dBV
dBV scale is used to measure input and output levels (on a decibel scale) for Consumer Audio equipment (or devices with Unbalanced inputs whereas dBu is used for Balanced inputs).
dBV specifies a relative voltage level (logarithmic voltage ratio) without impedance and with a reference voltage of V0 = 1.0000. This means 0 dBV = 1 volt (as opposed to the 0.7746 volts for dBu).
The formula to calculate dBV is the same as dBu: dBV = 20log (V1 / V0). Since V0 = 1 V, the equation can be re-written as dBV = 20log (V1 / 1) ==> dBV = 20log V1
The dBV rating is most commonly found in consumer equipment that uses nominal operating levels of -10 dBV. It is simply a standard that was adopted many years ago. To compute the equivalent Voltage, we need to calculate backwards. That means, ==> -10 dBV = 20log V1 ==> -10/20 = log V1 ==> -0.5 = log V1 ==> V1 = 10 (-0.5) = 0.3162 volts So, -10 dBV = 0.3162 Vrms

Negative dB meter in your DAW, Amplifier, Effect Processor
To explain why the dB meters show negative values with 0 dB as the maximum reading, we need to go back to the Analog world. Before that let us recap dBu & dBV
Voltage Ratio | dBu | dBV |
Reference Voltage | 0.7746 Vrms | 1 Vrms |
Impedance | 600 Ω | NO |
Type | Balanced | Unbalanced |
Main use | Professional Audio | Consumer Electronics |
Nominal Operating Level | +4 dBu = 1.2277 Vrms | -10 dBV = 0.316 Vrms |
0 dBVU (0 VU Meter) | 0 VU = +4 dBu | 0 VU = -10 dBV |
Type of connectors | TRS, XLR | TS, RCA |
Headroom
Every Analogue Audio Processing equipment (Amplifier, Compressor, Effect Processor etc.), has the following limitations.
(1) Noise Floor
At the quieter end, there is the infamous noise floor. It is usually a continuous background hiss into which signals can be dissolved until they become inaudible. The noise floor is the sum of all noise sources (low-level background noises a mic picks up + system-induced noise) within your system. That is why your average signal level must be at or above a certain value. If your signal strength is very low, the signal has a lot of noise added to it.
(2) Clipping
At the louder end, there is absolute signal-level limitation depending on an electronic equipment's power supply voltage and active circuitry. At this point, the system can no longer support any further increase in signal level and the result will be a distortion.
This is due to the signal level approaching the power supply voltage levels in analogue systems.
The range from the ideal signal level until the clipping happens is called Headroom. It is the ratio of the maximum amount of undistorted signal a system can handle compared to the average level for which the system is designed.
(3) Non-linearity
Tape decks, old vacuum-tube circuitry, transformers etc. tend to be the finest operating in their normal range but suffer increasing distortion as levels increase beyond their headroom.
Suppose you record too quietly (The average signal level was very low). During Mixing, you amplify the recorded signal to get a standard volume (in comparison to industry-standard volume). As you turned up your mix you realised that you were also turning up the noise that was hiding down in the noise floor. Eventually, at a higher volume level, the noise is audible as well.
Now you have cancelled the entire mix and decided to re-record with a hot signal (higher input level). You increased the preamplifier gain. Now your line level is much higher and you are getting a good signal-to-noise ratio. Suddenly something happened. There was the loudest portion of the song and the vocalist used all his energy to sing that note. BAAAM your input signal is now clipped! too bad. So on either end, your recording quality is not good at all.
Don't worry! The truth is that there is a sweet spot where you can set your line level. That level is called +4 dBu. This value was selected from years of observations on various recording systems. When your average line level is set at +4 dBu you have a very good dynamic range.
Dynamic Range = Distortion Ceiling - Noise Floor
Note: Some parts of the signal will be below +4 dBu which is fine and some signal peaks probably hit +12 dBu which is also fine. The average signal needs to be at +4 dBu. This is what makes a recording "High Quality." By attaining the best sound resolution, you can then make all of the proper mixing decisions because you can hear the smallest detail.
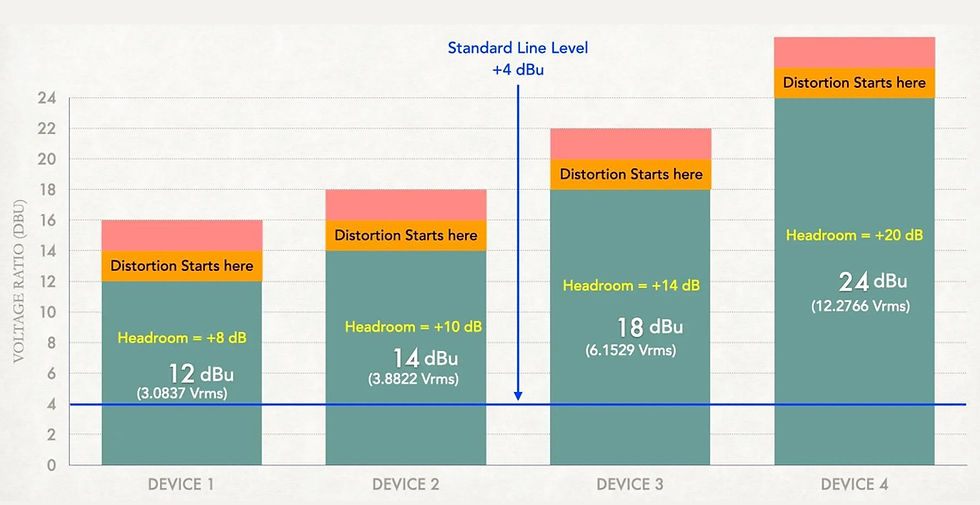
The headroom gives a buffer zone to contain unexpected transients or loud sounds without risking clipping. However, no analogue metering system displays much of the remaining headroom. Rather, it's an 'invisible' safe zone that is easy to overlook and take for granted. Most of the modern Analogue processors have a headroom of +20 dBu (Line Level +4 dBu, Distortion at +24 dBu)
Example (Head Room)
Suppose you have a recording setup with an average input level of +4 dBu (standard line level). If you can feed in a +18 dBu signal through your system without distortion, then you have 14 dBu (18 - 4) of headroom.
The maximum undistorted level of most of the audio amplifiers is +18 dBu (6.15 Vrms), which means it has +14 dBu (18 - 4) of headroom. In some countries, the maximum undistorted level is +24 dBu (12.28 Vrms), with a headroom of +20 dBu (24 - 4).
What happens if you push the gain knob above the headroom?
This highly gained signal level is now more than this particular device can handle due to the hardware limitation itself and the distortion of the signal begins. However, in Analogue devices, the clipping is not instant. It is a gradual distortion as you push the signal above the headroom. And it is found that these analogue distortions create harmonics which are pleasant to the human ears. This is called saturation.
If you further increase the gain (depending on the available headroom), the signal will start to clip and you can perceive it.
Higher headroom means you have a higher Dynamic range. That is why your vocal, acoustic guitar sounds much better when they are being recorded and processed through systems with higher headroom.
To get more headroom, some fellows have the habit of reducing the average signal level (input level from a microphone, processor etc.) below + 4 dBu. But what they do not understand is, that by doing it, the Signal to Noise ratio is also reduced.
You can see an example below.
Signal 1 is given at standard line level (+4 dBu) and signal 2 is at 0 dBu. Signal 2 has a lesser Signal-to-noise ratio. Interestingly, it is observed that the dynamic range remains the same whether the line level is increased or decreased (In the example below, the dynamic range is +84 dBu). So increasing the headroom by lowering the signal level will not serve any purpose, it only results in more noise.
Remember, Dynamic Range = Distortion Ceiling - Noise Floor
On the other hand, some fellows would reduce the headroom to get more S/N ratio. But there's no point if the source's signal‑noise ratio is considerably worse than the recording system's S/N ratio.

So to increase the headroom without affecting the S/N ratio, we need to increase the Dynamic range itself. This can be done by two methods.
(1) Lowering the Noise Floor
Record your vocals and instruments in a Soundproofed room so that the background noise is less. There are electronic circuit noises as well. This depends on the particular hardware itself. Cheaper preamps or mixers usually produce higher electronic noises. (This is why certain Analogue gears are very expensive and why the Audio recorded through those devices sounds much cleaner).
(2) Increasing the Distortion Ceiling
Most of the Analogue gears have a distortion ceiling of +24 dBu (12.277 Vrms). This is the maximum voltage produced when the analogue output is driven to the onset of distortion.
Some consoles are capable of having a distortion ceiling at +26 dBu.
Decibel Scale Meters - dBVU scale & VU Meter
+4 dBu is the sweet spot for line level. However, it will be confusing to show +4 as a standard reference on a meter. This gave rise to the standard dBVU (Decibel Volume Unit) unit. As a result, 0 dBVU was commonly defined as the critical point (or sweet spot) for an Analogue Audio gear.
Therefore 0 dBVU was chosen as the equivalent value for +4 dBu (for Professional Audio) & -10 dBV (Consumer Audio). The meter which is used to measure dBVU level is called a VU Meter.
It means when your Analogue Amplifier's VU meters show a “0 VU” value, your signal level is +4 dBu.

Picture Source: Wikipedia
A volume unit or “VU” meter is a voltmeter that reads an average of the signal and displays it with an attack and releases time of around 300 milliseconds.
VU meter only shows the RMS value and it can not show peaks.
The duration of most of the transients (e.g. Kick, snare) is shorter than 100 ms and the VU meter can't register it. The slower attack time permits the faster transients to sink before it registers the signal and gives a reading. Because of these properties, the VU meter is reasonably accurate when measuring the overall level of your Audio. It was created as a kind of loudness meter, rather than as a peak meter.
VU Meters are built like how the human ear perceives a sound. When you put a VU meter on your console, you are observing the energy and intensity of the sound. Our ears perceive average loudness more than the peaks. Most of the mixing tools you will use such as Compressors, EQs etc. are based on those old models from the analogue age. That means their sweet spot still exists.
That sweet spot is +4 dBu = 0 VU
VU Meters became systematised by the Acoustical Society of America in 1942. Since the design of VU is reasonably simple they were cheap and easy to implement in professional as well as consumer audio equipment. Typical VU meters usually measure only the upper 23 dB of the signal.
Anything above 0 VU (+4 dBu) is the headroom. Most of the modern analogue gears designed to work at +4 dBu line level are capable of delivering up to +24dB output levels. So at 0 VU, you have a headroom of 20 dB (24 – 4) to make sure that strong transients (peak values) do not distort (for example kick drum, or strong vocal emphasis etc.)
VU Meters indicate signal levels around the nominal operating level (0 VU) and they do not show the headroom margin at all. But we can figure out that when signals are averaging around the 0VU point (+4 dBu) there is about 20dB of headroom to capture the fast transient peaks that the meter can't show.
Note: Connecting a +4 dBu device (Professional Audio) to a consumer audio input may cause hazardous overloading, whereas the output of a consumer device (semi-professional audio devices) possibly does not have enough power to drive a professional audio input.
dBFS Meters (Decibel Full Scale)
The dB meter in your DAW to measure the Digital Audio Levels. It is not for measuring sound pressure level or intensity. Audio levels in digital systems are measured in dBFS (decibels relative to full scale). That is why we do not see a dBFS meter in a purely analogue system.
0 dBFS is the highest possible sample value of the analogue waveform in digital equipment. This means, there is no such thing as 1 dBFS or 2 dBFS. Some DAWs do show positive dBFS values to notify how much the signal has been clipped. You need to bring the fader/knob down accordingly. All other measurements expressed in terms of dBFS will always be less than 0 dB.
At 0 dBFS, all binary digits will be 1.
Example:
Suppose your A/D Converter is 3-bit (Most A/D converters are 16-bit or 24-bit). 3-bit binary can represent 2^3 values (=8 values). They are 000, 001, 010, 011, 100, 101, 110, 111 The highest possible sample will be represented as 111 and the lowest sample will be represented as 000.
Generally, most Analogue to Digital Converters (A/D Converters) has a voltage range of + / - 10 V (=20 V). This means, in the Digital scale, 0 dBFS is equivalent to 20 V. This is represented as 1 1 1 in binary. If you increase the analogue voltage above 20 V, then there will be no more remaining binary values to represent that signal in digital form. Hence clipping happens.

The maximum dynamic range of a 3-bit Digital Audio Processor will be 20 x Log (2^3) = 20 x Log (8) = 18.06 dB (approximately 18 dB).
Likewise, the maximum dynamic range of a 1-bit Digital Audio Processor will be 20 x Log (2^1) = 20 x Log 2 = 6.02 dB. It is safe to assume that the dynamic range of 1 bit is 6 dB
The maximum dynamic range of a 16-bit Audio Processor will be 16 x 6 = 96 dB
The maximum dynamic range of a 24-bit Audio Processor will be 24 x 6 = 144 dB The maximum dynamic range of a 32-bit Audio Processor will be 32 x 6 = 192 dB
I used the phrase "Maximum" Dynamic range. This is because, in the real world, it is almost impossible to attain this dynamic range due to the noise level present (If the total noise value is 0 dB, then the maximum dynamic range can be attained).
In modern analogue systems, where the standard signal is at +4 dBu (0 VU), there is enough headroom (+20 dB) before the distortion takes place.
In Digital Systems, 0 dBFS is the Maximum value. The digital meter is scaled downwards from the clipping point at 0 dBFS, hence the metering tends to show the entire headroom margin. The top 18 dB / 20 dB of a digital scale shows the headroom margin that is generally invisible on the meters of analogue systems (anything above 0 VU).
Because of that, many people assume they are 'under‑recording' on digital systems if they don't see their average signal around 0 dBFS when in fact they are over‑recording and at far greater risk of clipping.
Due to this puzzle, there needed to be a standard line level for the Digital System so that there would be enough headroom before the Digital Audio clipping occurred. So the Pros began to work backwards (from 0 to negative values) to find a nominal line level. This was initially observed to be at -20 dBFS, which means, that when the VU Meter is at 0, the equivalent Digital scale should show -20 dBFS. However it was noted (from different recordings over the years) that +20 dB headroom is quite a lot and if the nominal recording is set at -20 dBFS, the overall loudness of the mix is less.
This is why many digital recording pros calibrate their recording systems (DAWs) at -18 dB below 0 dBFS. Check your DAW Manual for the exact calibration (In some DAWs, it may be -20 dBFS calibrated as 0 VU) At a recording level of -18 dBFS, there is an extremely low chance that the transient peaks will hit 0 dBFS.
Analogue Line Level Vs 16-bit Digital Line Level

Analogue Line Level vs 24-bit Digital Line Level

In analogue systems, SNR (Signal to Noise Ratio) means the ratio of the given signal to the noise floor, where “line level” is the nominal operating level, which is +4 dBu (0 VU). The headroom is the difference between the line level and the peak level where signal distortion starts to occur.
Dynamic range is the difference between the Peak level and the Noise floor.
In Digital systems, SNR is the same as the dynamic range which is the difference between the Peak Level (0 dBFS) and the Noise floor.
Intersample Distortion
In a DAW, It’s recognised as a best practice to keep the master fader at 0 and use the channel faders to build the best balance instead of running the individual channel faders “hot” and bringing down the master fader to offset the signal. But there is a catch.
Most digital metering reflects the actual numerical value, so the numerical value that denotes 0 dBFS shows 0 on the meter. However, converting digital audio back to analogue may result in higher actual values than the samples themselves. This can happen if the level of some samples uses up the maximum available headroom in the Digital scale, and these high-level samples then pass through the D/A (Digital to Analogue) converter’s output smoothing filter to reconstruct the original waveform.
This reconstructed waveform might have a higher amplitude than the peak level of the samples, which means your Audio is now distorted. This is called Intersample Distortion.
Due to this phenomenon, many mastering engineers recommend absolute peak levels not exceeding -1.0 dBFS in the DAW meter.
This blog is about the Decibel Scale – Complete Guide
Comments